ChatGPT
  Perplexity
  Gemini
  Claude AI
 Have you come across those cool interactive graphs where nodes float around and connect to each other? That’s a network graph!
A network graph is a visualization tool used to display interconnected entities. Imagine it as a map of points (nodes) connected by lines (links) that represent their relationships. It helps to picture complex data making it easier to understand connections and find hidden patterns. These graphs are widely used from creating a simple diagram to complex, dynamic graphs. One of the popular libraries for these use cases is D3 graph. D3 is an open source javascript library for visualizing data, it offers flexibility in creating dynamic, data-driven graphs enabling fine grained control over the visual and provides granular level customization. React takes care of the user interface, efficiently managing layout and state, meanwhile D3.js helps shape and animate the connections, transforming raw data into interactive visuals, with this combination we can create data driven illustrations with seamless experience.
In this blog, we’ll walk through how to create a simple network graph and by the end, you’ll be able to create one on your own.
Prerequisites
- Node.js installed (version 18 or later)
- Basic understanding of React and Typescript.
Getting Started
Create a React application
Create a react app using vite
npm create vite@latest
Install node modules
npm i
Setting up D3
To install d3 graph, run
npm i d3
Clean up the initial boilerplate code that comes with Vite. Create a new file inside the src folder called NetworkGraph.tsx (if you are using Javascript, use the .jsx extension) within the file, create a React component called NetworkGraph and import this new component in the App.tsx file.
If you are using typescript in your React application then you will have to install the types, you can do that by
npm i --save-dev @types/d3
Source Code for the Network Graph
import React, { useEffect, useRef } from "react";
import * as d3 from "d3";

interface NodeType extends d3.SimulationNodeDatum {
 id: string;
 group: string;
}
interface LinkType extends d3.SimulationLinkDatum<NodeType> {
 source: string | NodeType;
 target: string | NodeType;
 score: number;
}

const NetworkGraph = () => {
   const nodes: NodeType[] = [
       { id: "Myriel", group: "team1" },
       { id: "Anne", group: "team2" },
       { id: "Bob", group: "team1" },
       { id: "Charles", group: "team2" }
     ];
     const links: LinkType[] = [
       { source: "Anne", target: "Myriel", score: 3 },
       { source: "Bob", target: "Myriel", score: 5 },
       { source: "Charles", target: "Anne", score: 8 },
       { source: "Bob", target: "Anne", score: 6 }
     ];

     const canvasRef = useRef<HTMLCanvasElement>(null);
     const initForceGraph = (canvas: HTMLCanvasElement) => {
       const context = canvas.getContext("2d");
       if (!context) return () => {};
       const width = 800;
       const height = 600;
       canvas.width = width;
       canvas.height = height;

       // force simulation setup
       const simulation = d3.forceSimulation<NodeType>(nodes)
         .force("link", d3.forceLink<NodeType, LinkType>(links).id(d => d.id).distance(100))
         .force("charge", d3.forceManyBody().strength(-150))
         .force("center", d3.forceCenter(width / 2, height / 2))
         .on("tick", render); // this calls render on each tick

       function render() {
         if (!context) return;
         context.clearRect(0, 0, width, height);

         // Draw links
         links.forEach((link) => {
           const source = link.source as NodeType;
           const target = link.target as NodeType;
           context.beginPath();
           context.moveTo(source.x!, source.y!);
           context.lineTo(target.x!, target.y!);
           context.strokeStyle = "#999";
           context.lineWidth = 1;
           context.stroke();
         });

         // Draw nodes
         nodes.forEach((node) => {
           context.beginPath();
           context.arc(node.x!, node.y!, 5, 0, 2 * Math.PI);
           context.fillStyle = node.group === "team1" ? "blue" : "red";
           context.fill();

           context.fillStyle = "#000";
           context.font = "10px sans-serif";
           context.textAlign = "center";
           context.textBaseline = "middle";
           context.fillText(node.id, node.x!, node.y! - 10);
         });
       }

       render();

       return () => {
         simulation.stop();
       };
     }

     useEffect(() => {
       const canvas = canvasRef.current;
       if (!canvas) return;

       const cleanup = initForceGraph(canvas);
       return cleanup;
     }, []);

     return <canvas ref={canvasRef} />;
};

export default NetworkGraph
First, D3 needs a target DOM element to draw graphics or to manipulate elements. So let’s create a container to hold all the elements like nodes, labels and links, this can be done either using the <svg> element or HTML <canvas> element and then render it inside the component using JSX.
You can create a network graph with svg or canvas, choosing either of it totally depends on the use case. With svg it’s easier to style with CSS, great for smaller datasets and when accessibility is a priority but it becomes performance heavy when rendering hundreds or thousands of elements as it creates a separate DOM element for each shape, link or label. On the other hand, canvas uses an immediate mode rendering model where you draw pixels directly onto a canvas context making it faster and more memory-efficient for large or frequently updating datasets. So, the decision really comes down to performance versus convenience. Canvas for speed and scale, SVG for ease and clarity. Import useRef hook from react and use it to create a reference to a DOM element that will point to the canvas element.
import { useRef } from "react";
const canvasRef = useRef<HTMLCanvasElement>(null);
This allows us to interact with the actual <canvas> element directly via the useRef hook.
<HTMLCanvasElement> is a built-in TypeScript DOM type that gives you access to its properties and methods like getContext(), width, height etc, it is used for type checking when calling canvas-specific methods.
Initially, canvasRef.current is null, but once the component mounts, React assigns the reference to the rendered <canvas> element. This gives us direct access to its DOM API, including methods like getContext(“2d”), enabling us to draw on it using D3’s rendering logic.
return <canvas ref={canvasRef} />
This binds the reference (canvasRef) to the actual <canvas> element in the DOM, we can access the <canvas> element inside useEffect.
Defining Nodes and Links
The building blocks of a network graph are nodes and links. These define the input data for the graph, where each node represents a single entity, and each link represents a connection between nodes. Now to further build on the empty canvas, we can add nodes, links, and position the elements.
Nodes represent data points, it is an object that contains an unique identifier (id) and data for grouping or for labeling. Optionally, it can include x and y coordinates , however D3 assigns these dynamically based on the force simulation.
Relationships are defined in the links array, where each link references a node's id. A link defines a connection between two nodes and will have minimum two attributes, source and target. Each link connects a source node to a target node and optionally carries additional metadata (like weight/strength) based on usage.
Now that we have created a container, we’ll render the nodes and links. Before that, as we are using typescript, we let’s define the types for the nodes and links.
interface NodeType extends d3.SimulationNodeDatum {
	id: string;
	group: string;
}
interface LinkType extends d3.SimulationLinkDatum<NodeType> {
	source: string | NodeType;
	target: string | NodeType;
	value: number;
}
We need to ensure that nodes and links follow D3’s expected structure so that the simulation can properly update x and y coordinates and links correctly reference their source and target nodes.
D3 provides SimulationNodeDatum and SimulationLinkDatum as interfaces to define the structure of nodes and links in a force simulation. By extending SimulationNodeDatum, we ensure that our NodeType has these properties, making it compatible with D3's simulation functions. SimulationLinkDatum is required by D3’s forceLink to correctly resolve and connect nodes. By extending SimulationLinkDatum<NodeType>, we ensure it works with D3’s forceLink.
As we are building a basic graph, we are using simple hardcoded nodes and link values, you can always customize it according to your requirements.
How is the network diagram created?
We define a function initForceGraph that takes a parameter which is a reference to the <canvas> element. This is how we’ll draw everything: nodes, links, and labels.
Let’s create a function called initForceGraph to set up the canvas dimensions and handle rendering logic for the graph.
const context = canvas.getContext("2d");
       if (!context) return () => {};
canvas has a built-in method called getContext(“2d”) that gives us the 2D drawing context, which exposes methods for drawing shapes, lines, text, and more on the canvas. If context is not available then we provide a clean up function to exit in such cases to keep the code predictable and error-free.
       const width = 800;
       const height = 600;
       canvas.width = width;
       canvas.height = height;
We manually set the canvas width and height in pixels.This ensures our canvas has enough space to render the entire graph and keeps our simulation centered properly.
       // Basic force simulation setup
       const simulation = d3.forceSimulation<NodeType>(nodes)
         .force("link", d3.forceLink<NodeType, LinkType>(links).id(d =>       d.id).distance(100))
         .force("charge", d3.forceManyBody().strength(-150))
         .force("center", d3.forceCenter(width / 2, height / 2))
         .on("tick", render);
Now, we create a new D3 force simulation and pass in our array of nodes.
This simulation will calculate the x and y positions for each node based on forces like gravity, collision, and link distance.
forceLink - adds a link force that keeps connected nodes at a specific distance from each other and to uniquely identify each node by its id property, ensuring links bind to the right nodes.
forceManyBody - adds a force, either attraction or repulsion between nodes. Here, negative strength value means nodes repel each other, preventing overlap.
forceCenter - like the name suggests, this force nudges all nodes towards the center of the canvas, keeping the graph roughly balanced within the visible area.
Every time the simulation updates node positions, it calls the render function to redraw everything based on the latest coordinates.
function render() {
  if (!context) return;
  context.clearRect(0, 0, width, height);
Next we have a render function which is used to draw the latest graph. We first clear the entire canvas to remove the previous frame to make sure we draw the latest graph state, preventing visual trails or overlaps.
Drawing Nodes
nodes.forEach((node) => {
           context.beginPath();
           context.arc(node.x!, node.y!, 5, 0, 2 * Math.PI);
           context.fillStyle = node.group === "team1" ? "blue" : "red";
           context.fill();
Using nodes.forEach, we will be looping over the array of nodes and drawing them one by one on the canvas. context.beginPath() is called to start fresh, it tells the canvas that it is starting a new shape, if the shape is not called, it might accidentally get connected or overlapped. Context.arc is used to draw a circle, then x and y coordinates and included which will be later calculated by the D3’s simulation. Here 5 is the radius of the node and the other two parameters are start angle and end angle of the circle respectively. We then use fillstyle to set the color based on the team, and fill() to fill the circle, making it a solid shape.
Displaying labels
 context.fillStyle = "#000";
           context.font = "10px sans-serif";
           context.textAlign = "center";
           context.textBaseline = "middle";
           context.fillText(node.id, node.x!, node.y! - 10);
})
For each node, we’ll add labels, assign the color black (“#000”), set a basic font and size, center-align the text and display the node’s id slightly above the node’s position.
Drawing Links
 links.forEach((link) => {
           const source = link.source as NodeType;
           const target = link.target as NodeType;
           context.beginPath();
           context.moveTo(source.x!, source.y!);
           context.lineTo(target.x!, target.y!);
           context.strokeStyle = "#999";
           context.lineWidth = 1;
           context.stroke();
         });
To draw lines, we loop through the links and draw a line from each source node to its target node. The Canvas 2D API uses something called a path, which is a series of connected lines, arcs, or shapes. When beginPath() is called, it begins a new drawing sequence. Afterward, methods like lineTo() tell the canvas to draw a line from the starting point to the target. moveTo() begins the line at the source, while lineTo() draws it toward the target and stops there. The links are drawn in a neutral grey color (#999) with a line width of 1 pixel.
render();
Before the simulation starts moving nodes around, we call an initial render so the graph is immediately visible.
      return () => {
         simulation.stop();
       };
To prevent memory leaks or unwanted background activity, we stop the D3 simulation when the component unmounts.
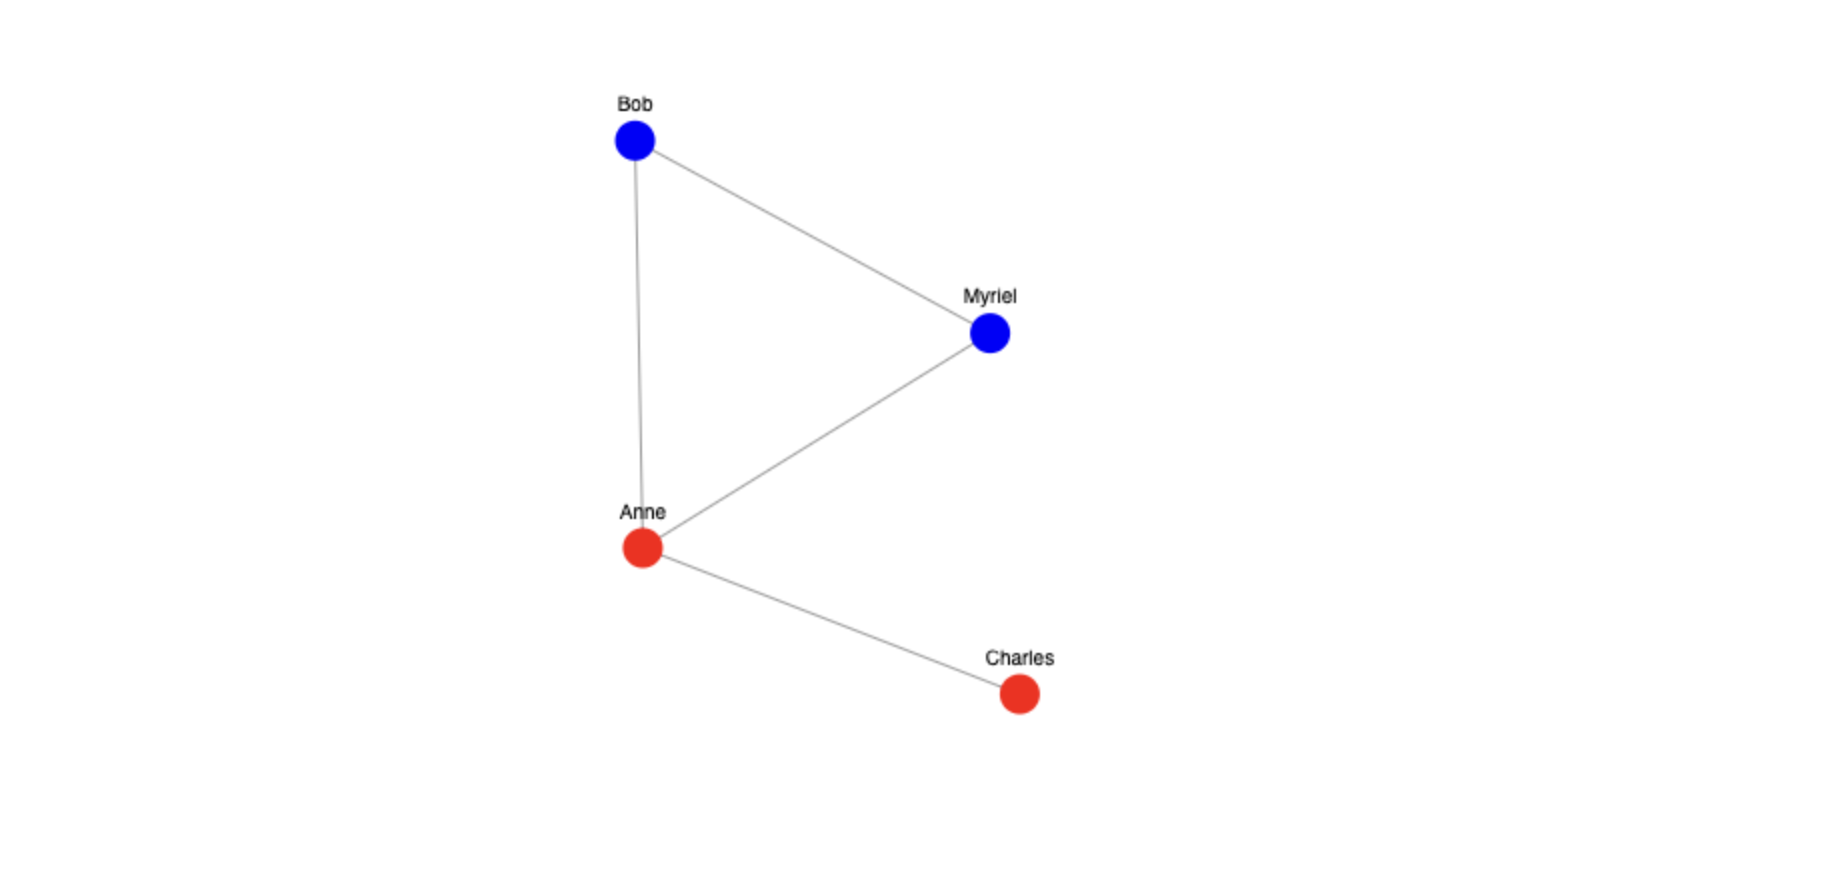
Finally, we invoke the initForceGraph function inside the useEffect hook to render the nodes, links and labels as soon as the page loads.
And once everything is wired together, we’ll have a simple network graph like this. Check out the live project here
Enhancing Interactivity
In addition to dragging, we can add more interactive features to improve the user experience which we will learn later in another blog, like setting a default zoom level, highlighting nodes and their connections when hovered over and enabling zoom-in and zoom-out functionality. These enhancements make the network graph more interesting and visually engaging.
Conclusion
While this blog focuses on D3, there are many tools for building network graphs, such as React Flow and Nivo Charts, D3.js stands out to me because of its flexibility. It allows for deep customization, enabling to fine tune every aspect of the graph from interactivity, styling to force simulations giving me complete control over the visualization, all without any cost.