ChatGPT
  Perplexity
  Gemini
  Claude AI
 Understanding what's happening in our current serverless systems is challenging due to a lack of proper observability. When logs aren't clear, and we can't see the whole picture of AWS Lambda functions, troubleshooting becomes hard. This can result in missing unusual events, reliability problems, and overall system efficiency taking a hit.
Current Problems:
- Unorganized logs and limited visibility into AWS Lambda operations
- Inefficient troubleshooting impacts user experience
- Ineffective monitoring and missed anomalies
- Unstructured logs create difficulty in data analysis
- Poor resource utilization and potential security risks
Using tools like CloudWatch logs and CloudWatch Insights along with lambda advanced logging features is essential for smoother operations, quicker issue resolution, and better overall observability and performance.
Let's take the example of payment transactions. Having clear and consistent logs would make it easy to look at the data and quickly fix any problems that might come up. By using AWS Lambda for logging in a structured way and tools like CloudWatch Insights for monitoring will give us the powerful observability feature, we can make sure our logging and monitoring process is organized and helps us understand and fix issues quickly.
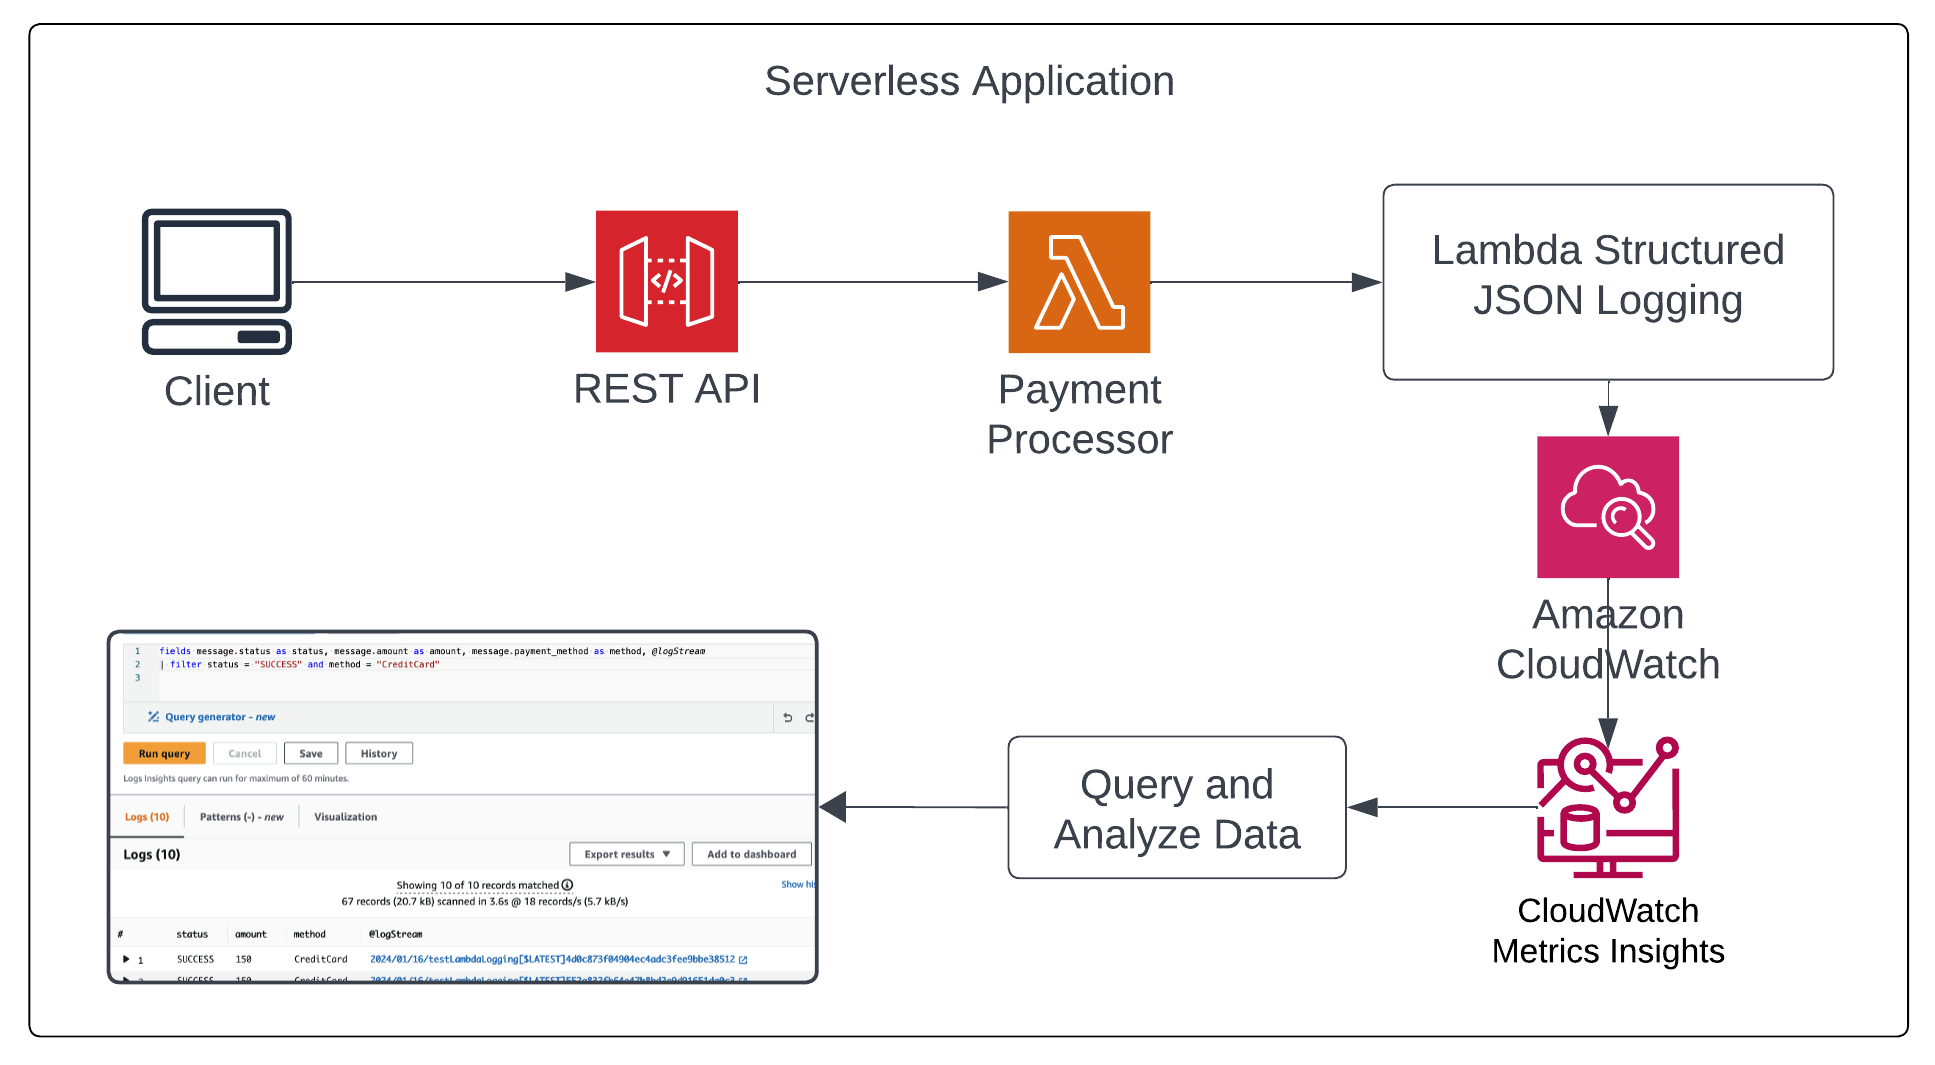
Cloudwatch Logs Insights:
With CloudWatch Logs Insights, we can easily search and analyze log data in Amazon CloudWatch Logs. This helps us quickly respond to any issues that come up. If there's a problem, CloudWatch Logs Insights helps us figure out what might be causing it and check if any fixes we have implemented are working. It features a user-friendly query language, providing sample queries, command descriptions, autocompletion, and log field discovery for a seamless start. Pre-built sample queries cater to various AWS service logs, enhancing usability. For more information Cloudwatch Logs Insights
AWS Lambda Advanced Logging:
To help developers and operators monitor and troubleshoot failures, the Lambda service automatically captures and sends logs to CloudWatch Logs. Lambda now natively supports capturing structured logs in JSON format as a series of key-value pairs, making it easier to search and filter logs more easily. JSON also enables you to add custom tags and contextual information to logs, enabling automated analysis of large volumes of logs to help understand the function performance. For more information AWS Lambda Advanced Logging
With the introduction of a new JSON log format by lambda, it is possible and easy to query logs based on the level of the log like INFO, DEBUG, WARN, and ERROR. This helps developers to debug the issue and set the resolution if there are any errors quickly. Let's look at the CloudWatch insights on how to get the logs based on the level filtering, below image shows the Cloudwatch insights query to fetch only ERROR level logs to examine.
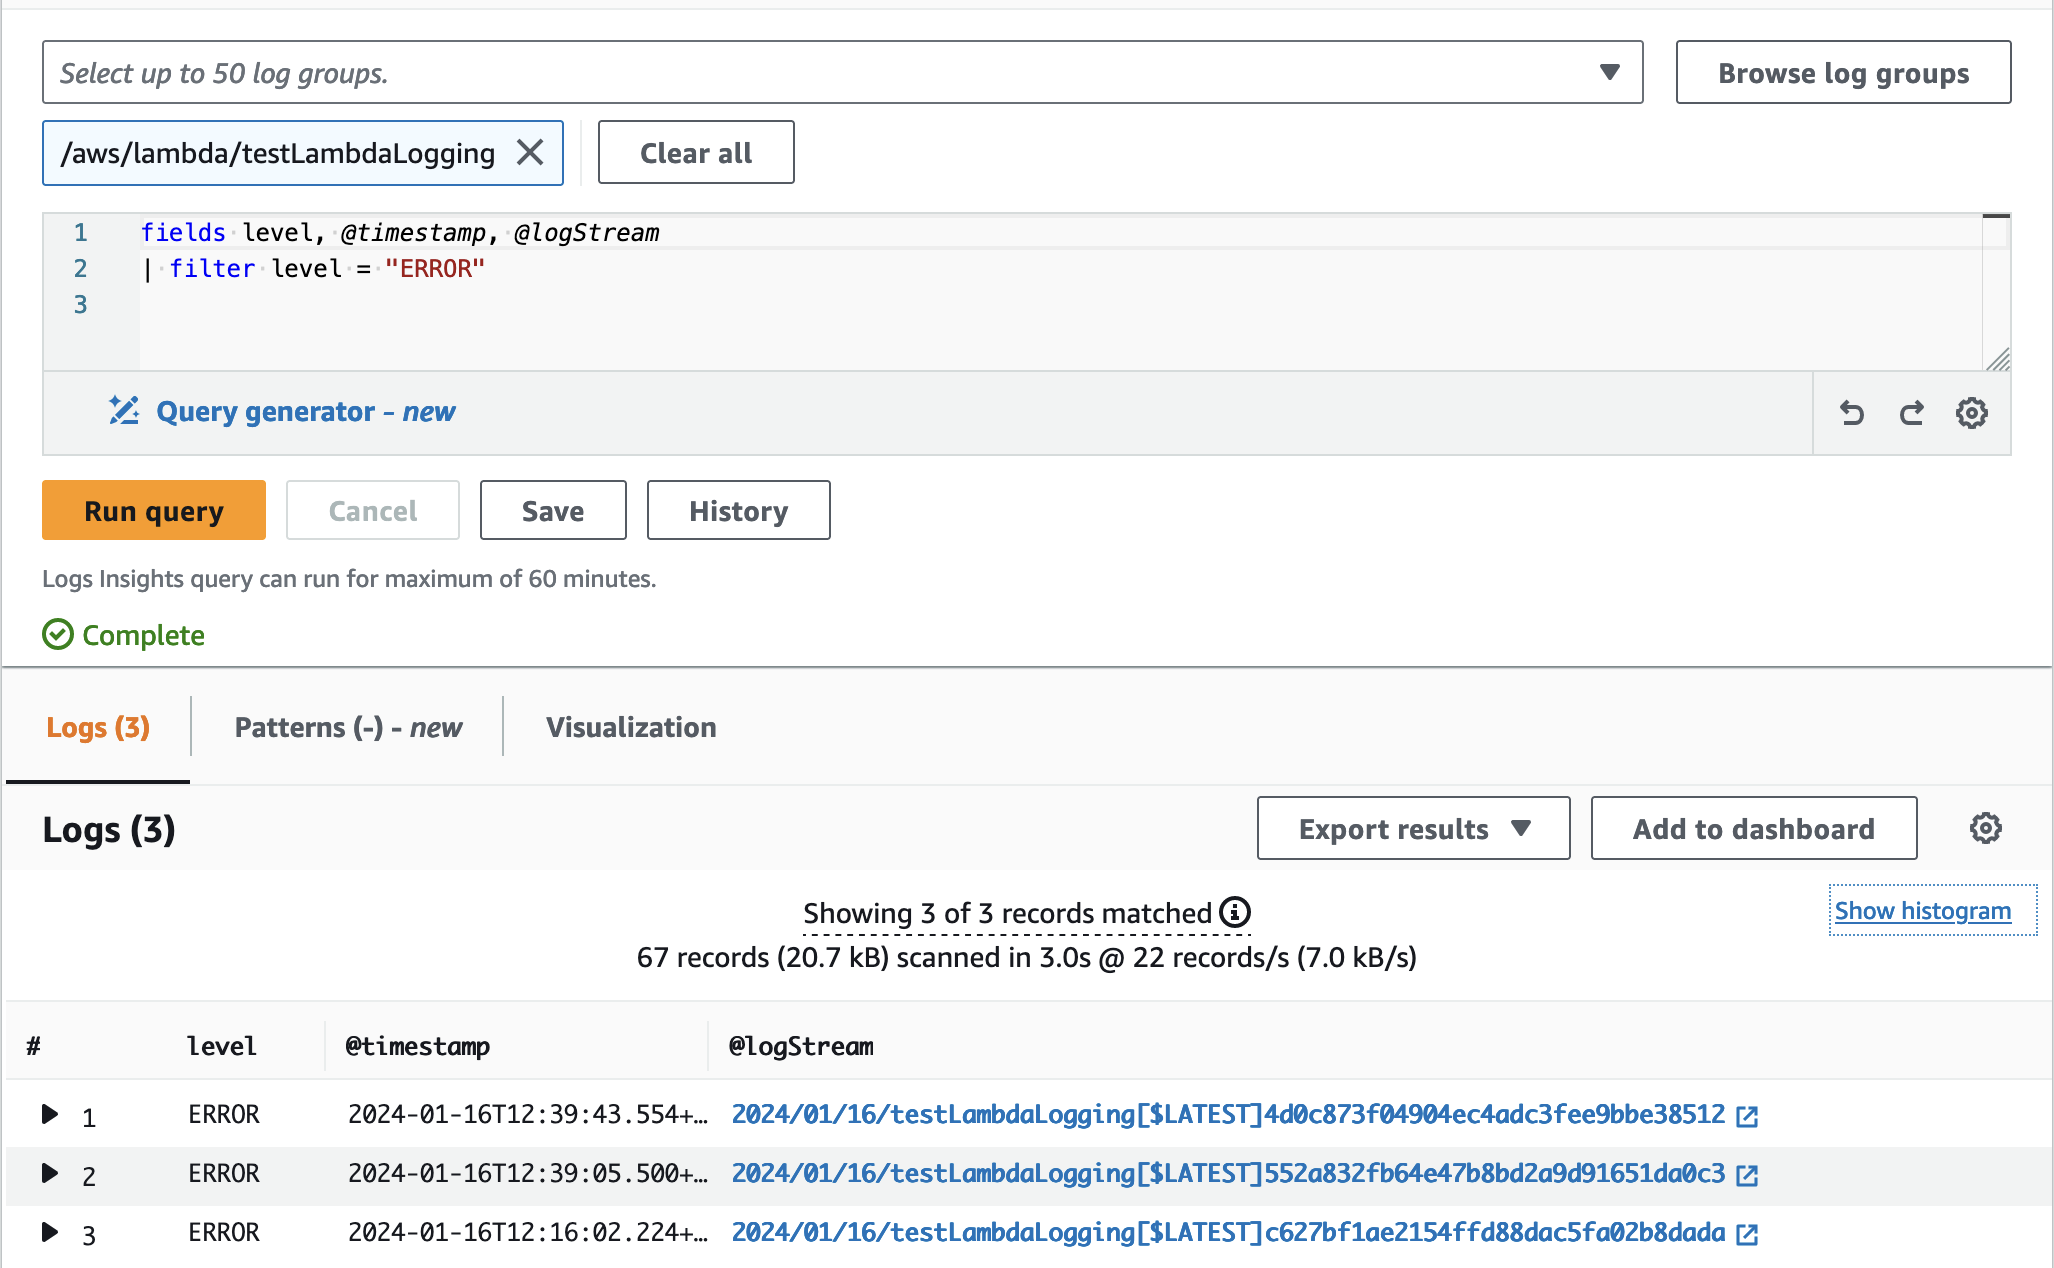
From the above image, the fields key is the query command where we can set what fields or data needs to be extracted from the log. We are querying the log level, @timestamp, and the @logStream link to the detailed Cloudwatch log.
Let's examine the payment processing logs to extract relevant information and address any necessary actions. In this context, we may need to query data for various scenarios such as identifying successful transactions, isolating error logs, or determining the count of failed or successful transactions within a specified timeframe.
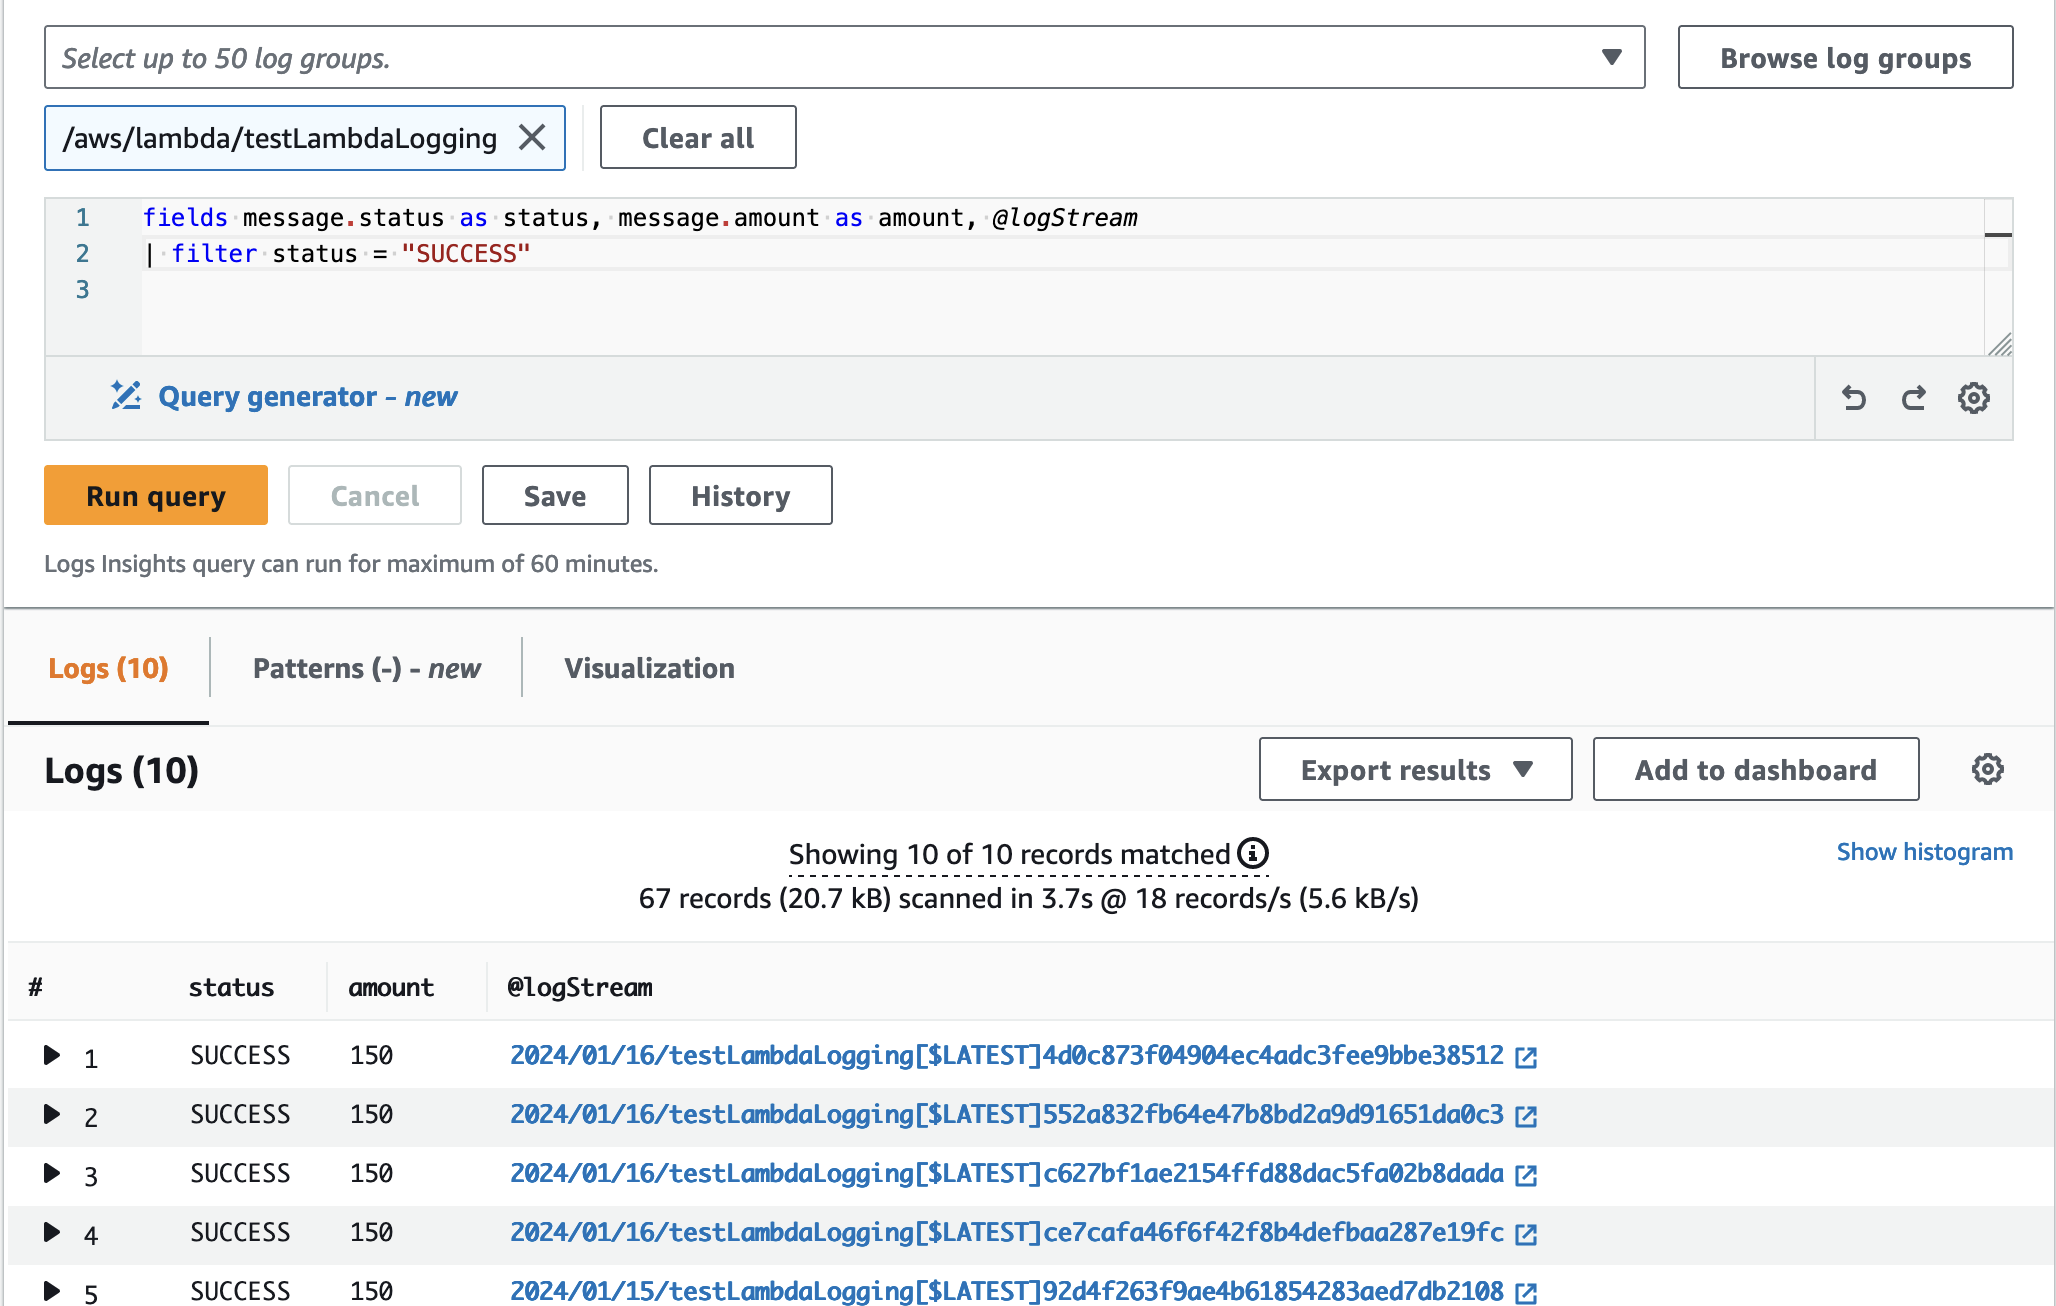
As shown in the above image we can use the filter command to get all the logs based on the status key as SUCCESS
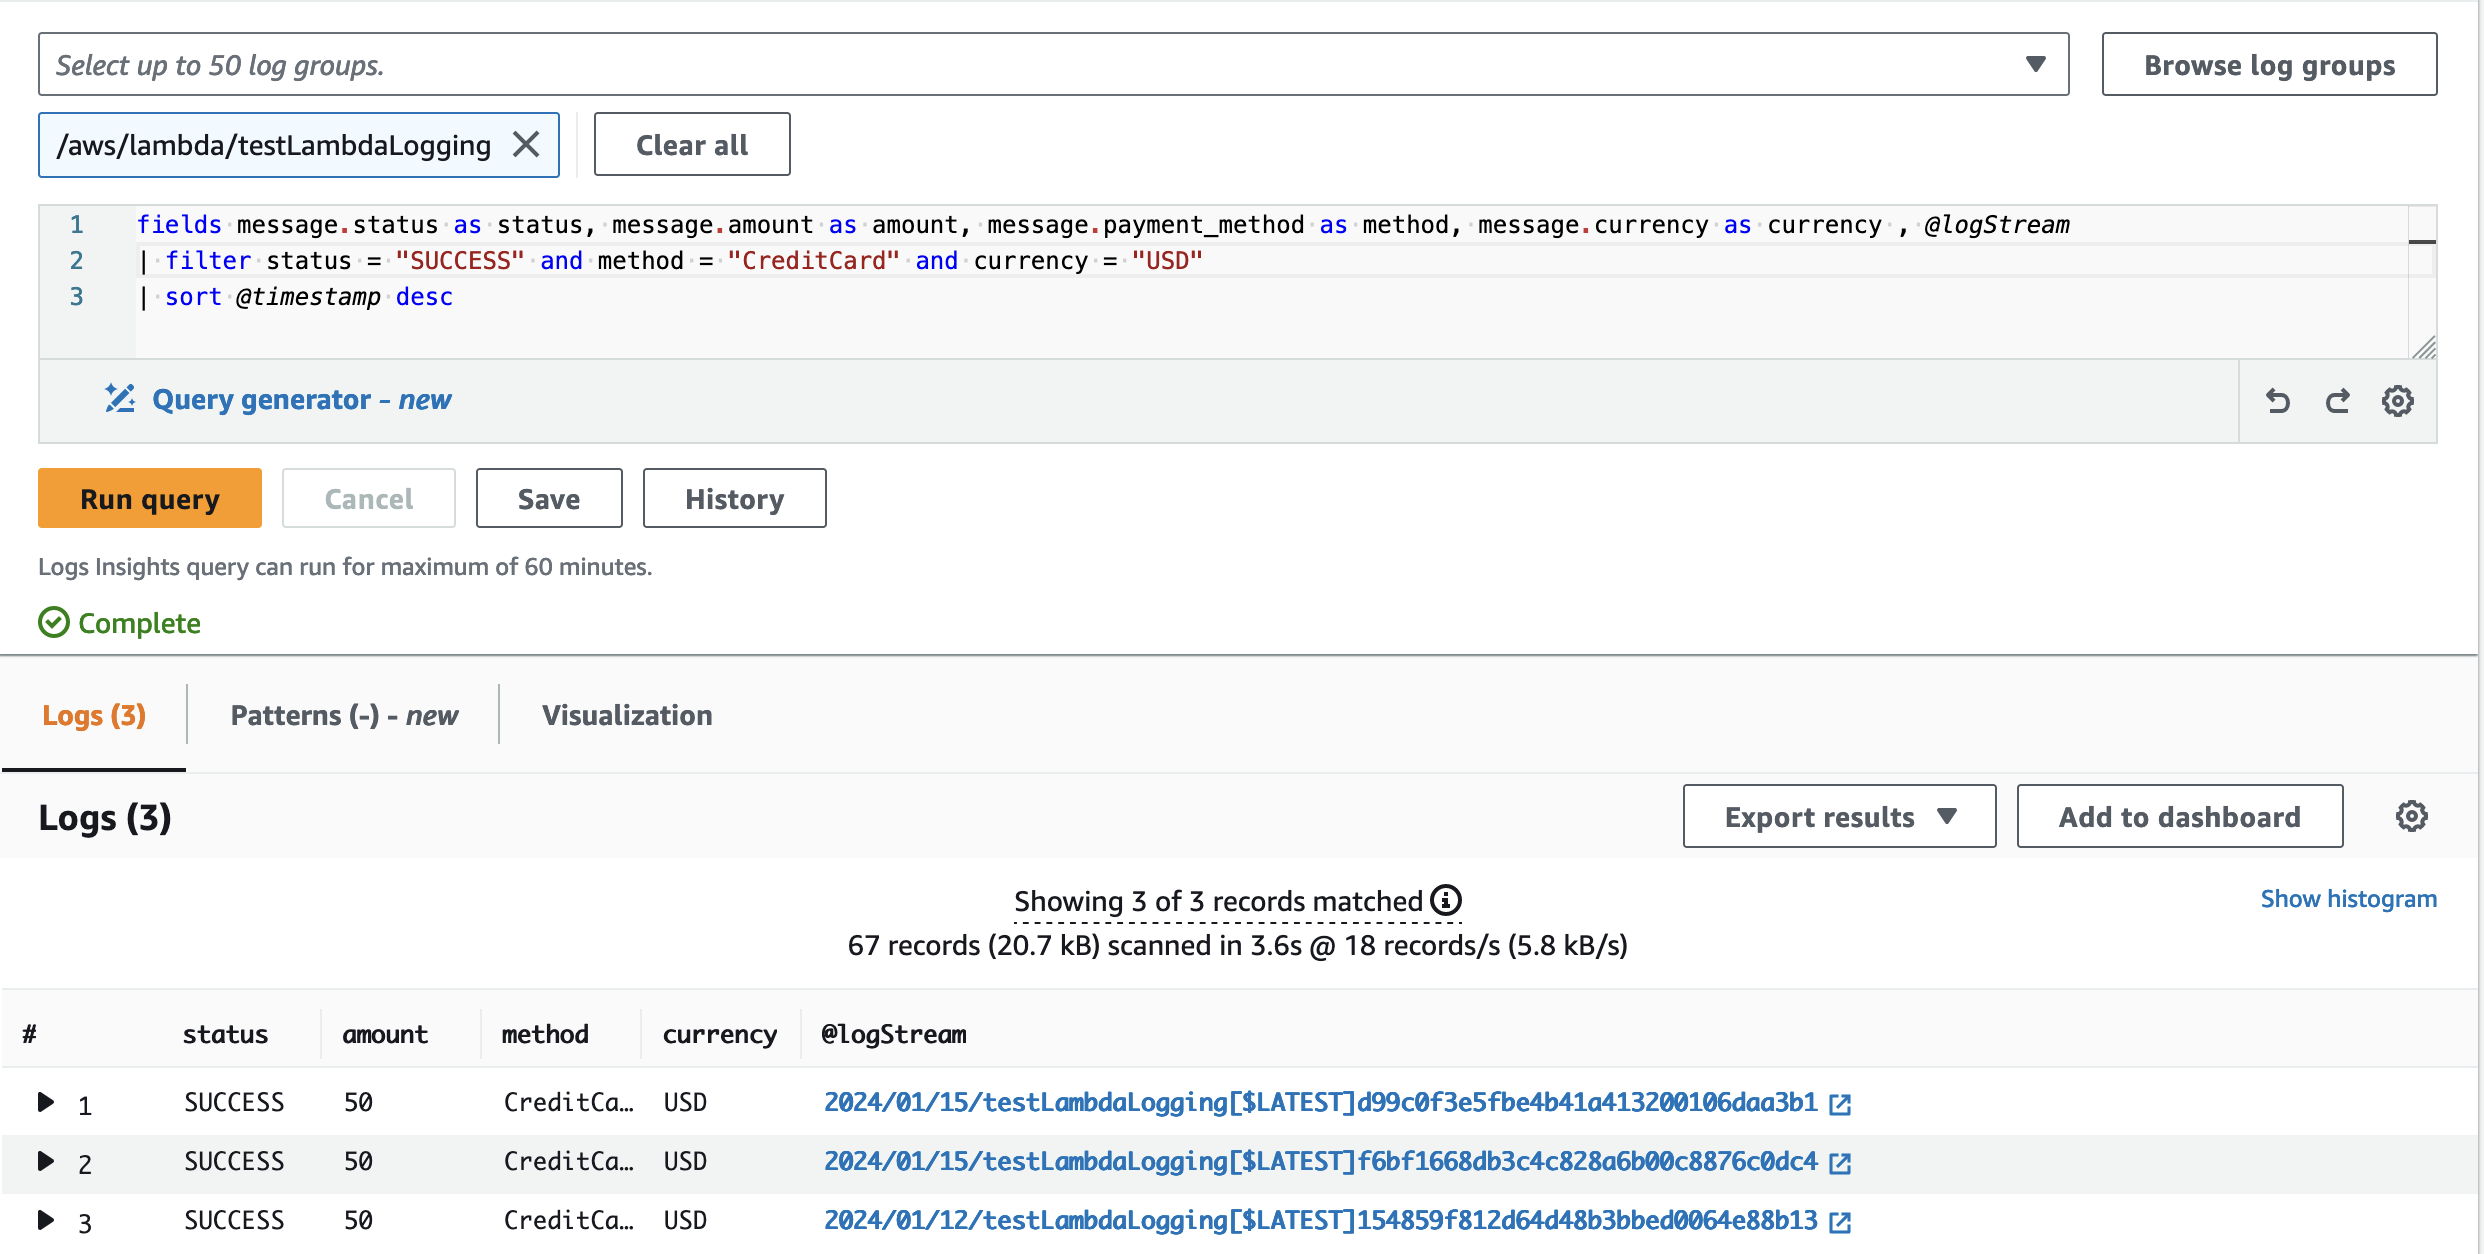
With the filter command, we can write multiple conditions to get specific logs by using comparison operators such as =, !=, >, >=, <, <=, boolean operators such as and, or, and not, and regular expressions. In the image we are getting the logs with status as SUCCESS, the payment_method is CreditCard, and the currency is USD, along with the filter we are also using the sort command to list and sort the logs based on the timestamp.
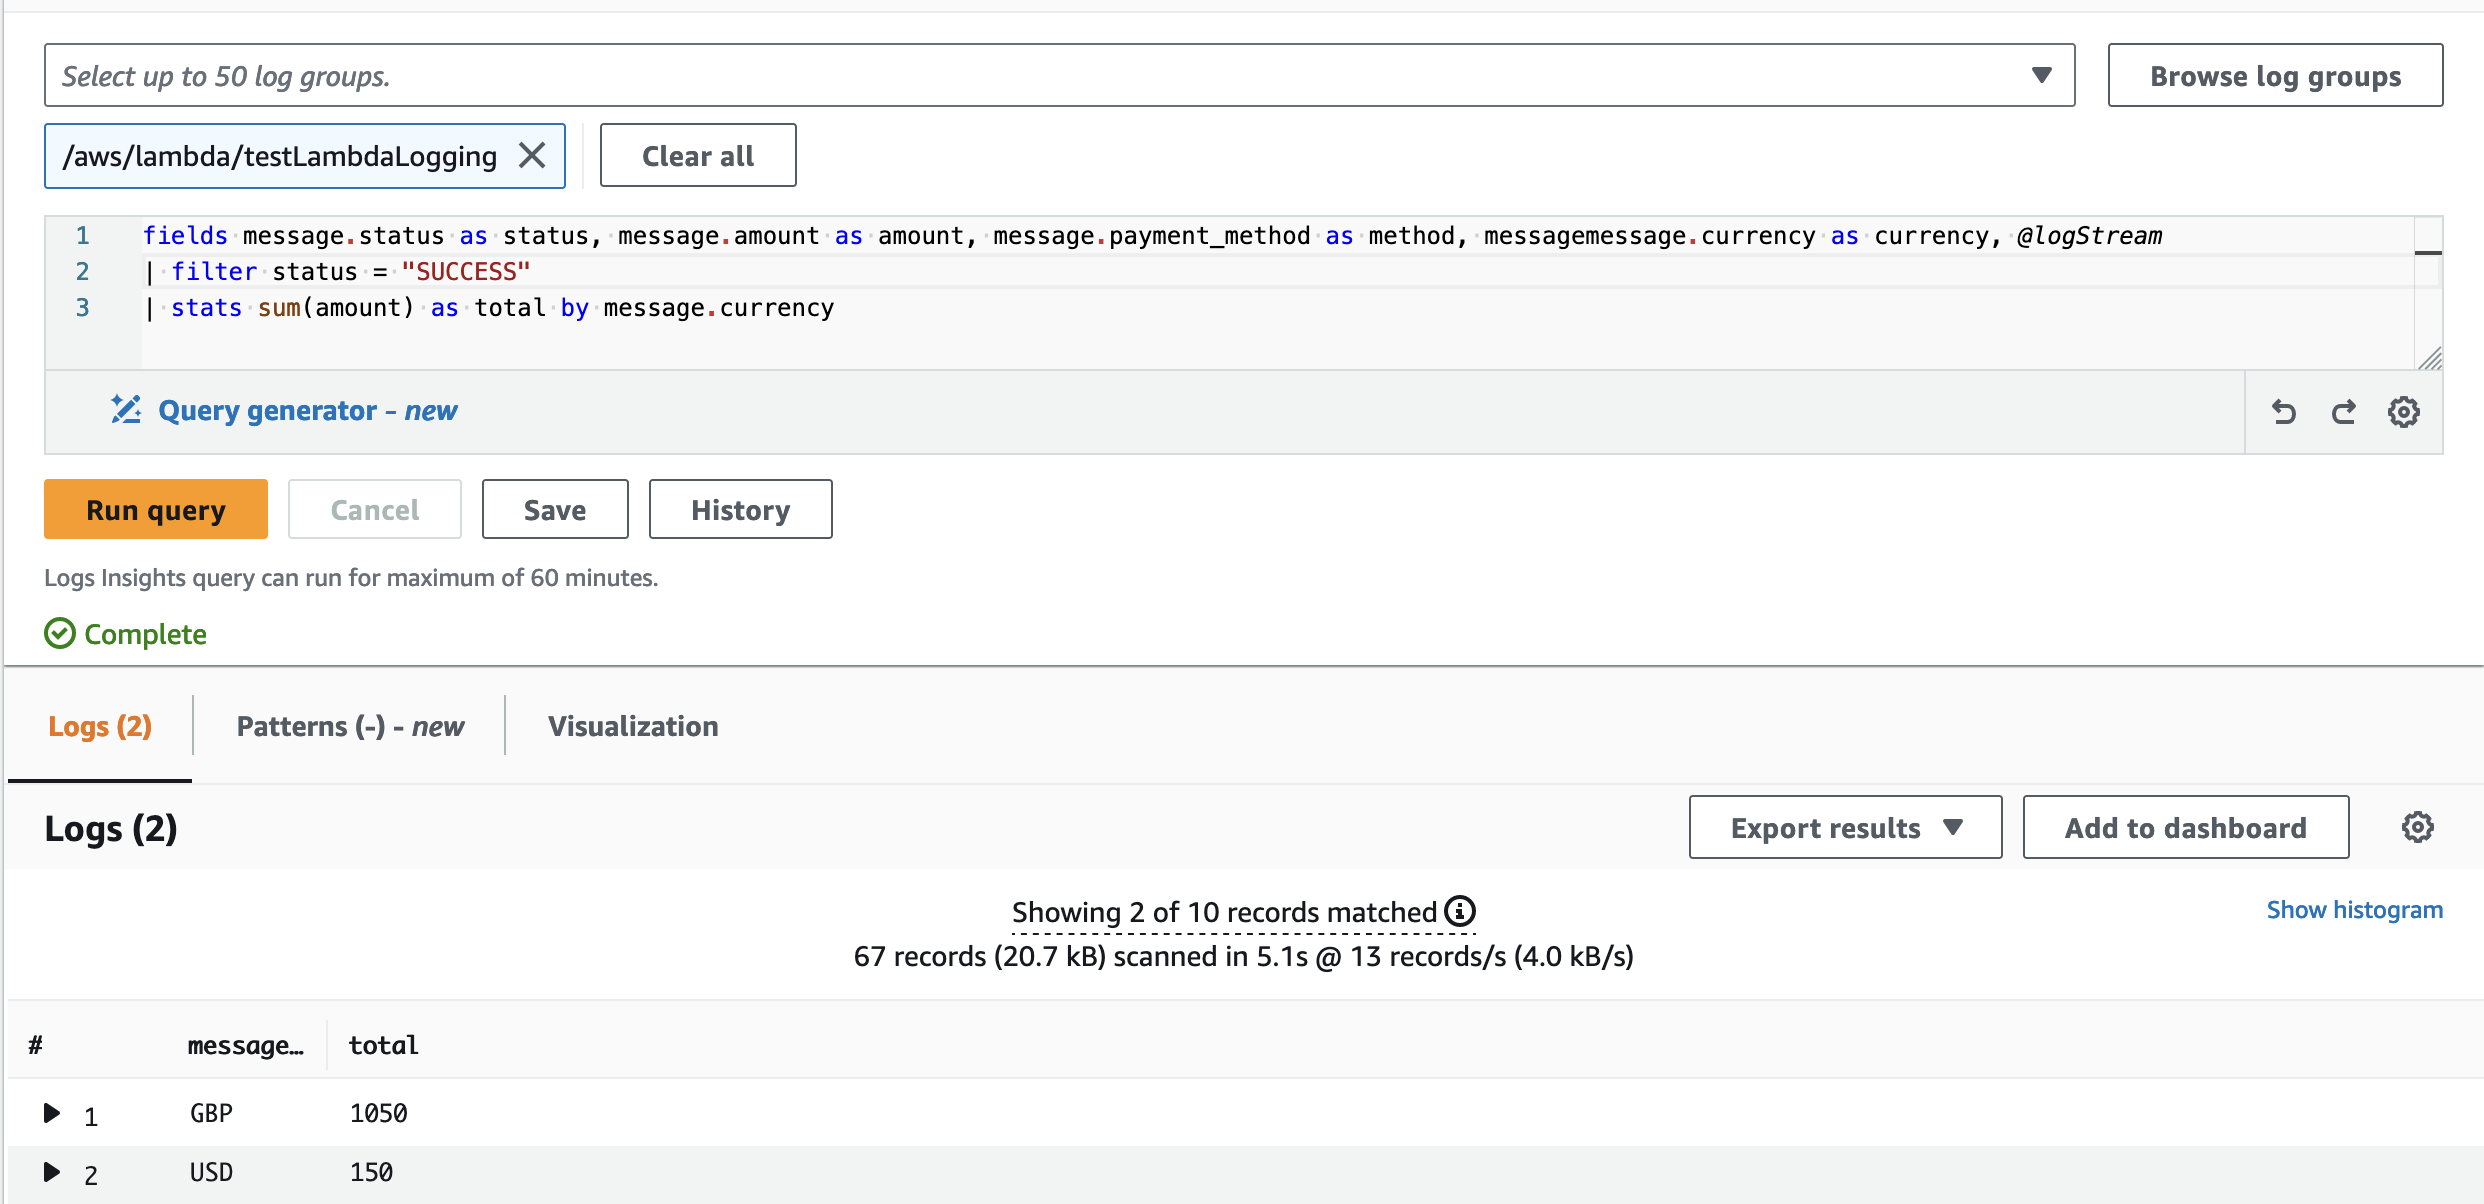
Another powerful command in the Cloudwatch insights is stats, by using this we can calculate aggregate statistics such as sum(), avg(), count(), min(), and max() for log fields. In the above example, we are calculating the sum of the transacted amount for the logs that have been completed with the status of SUCCESS and group them by the type of currency used (USD and GDP).
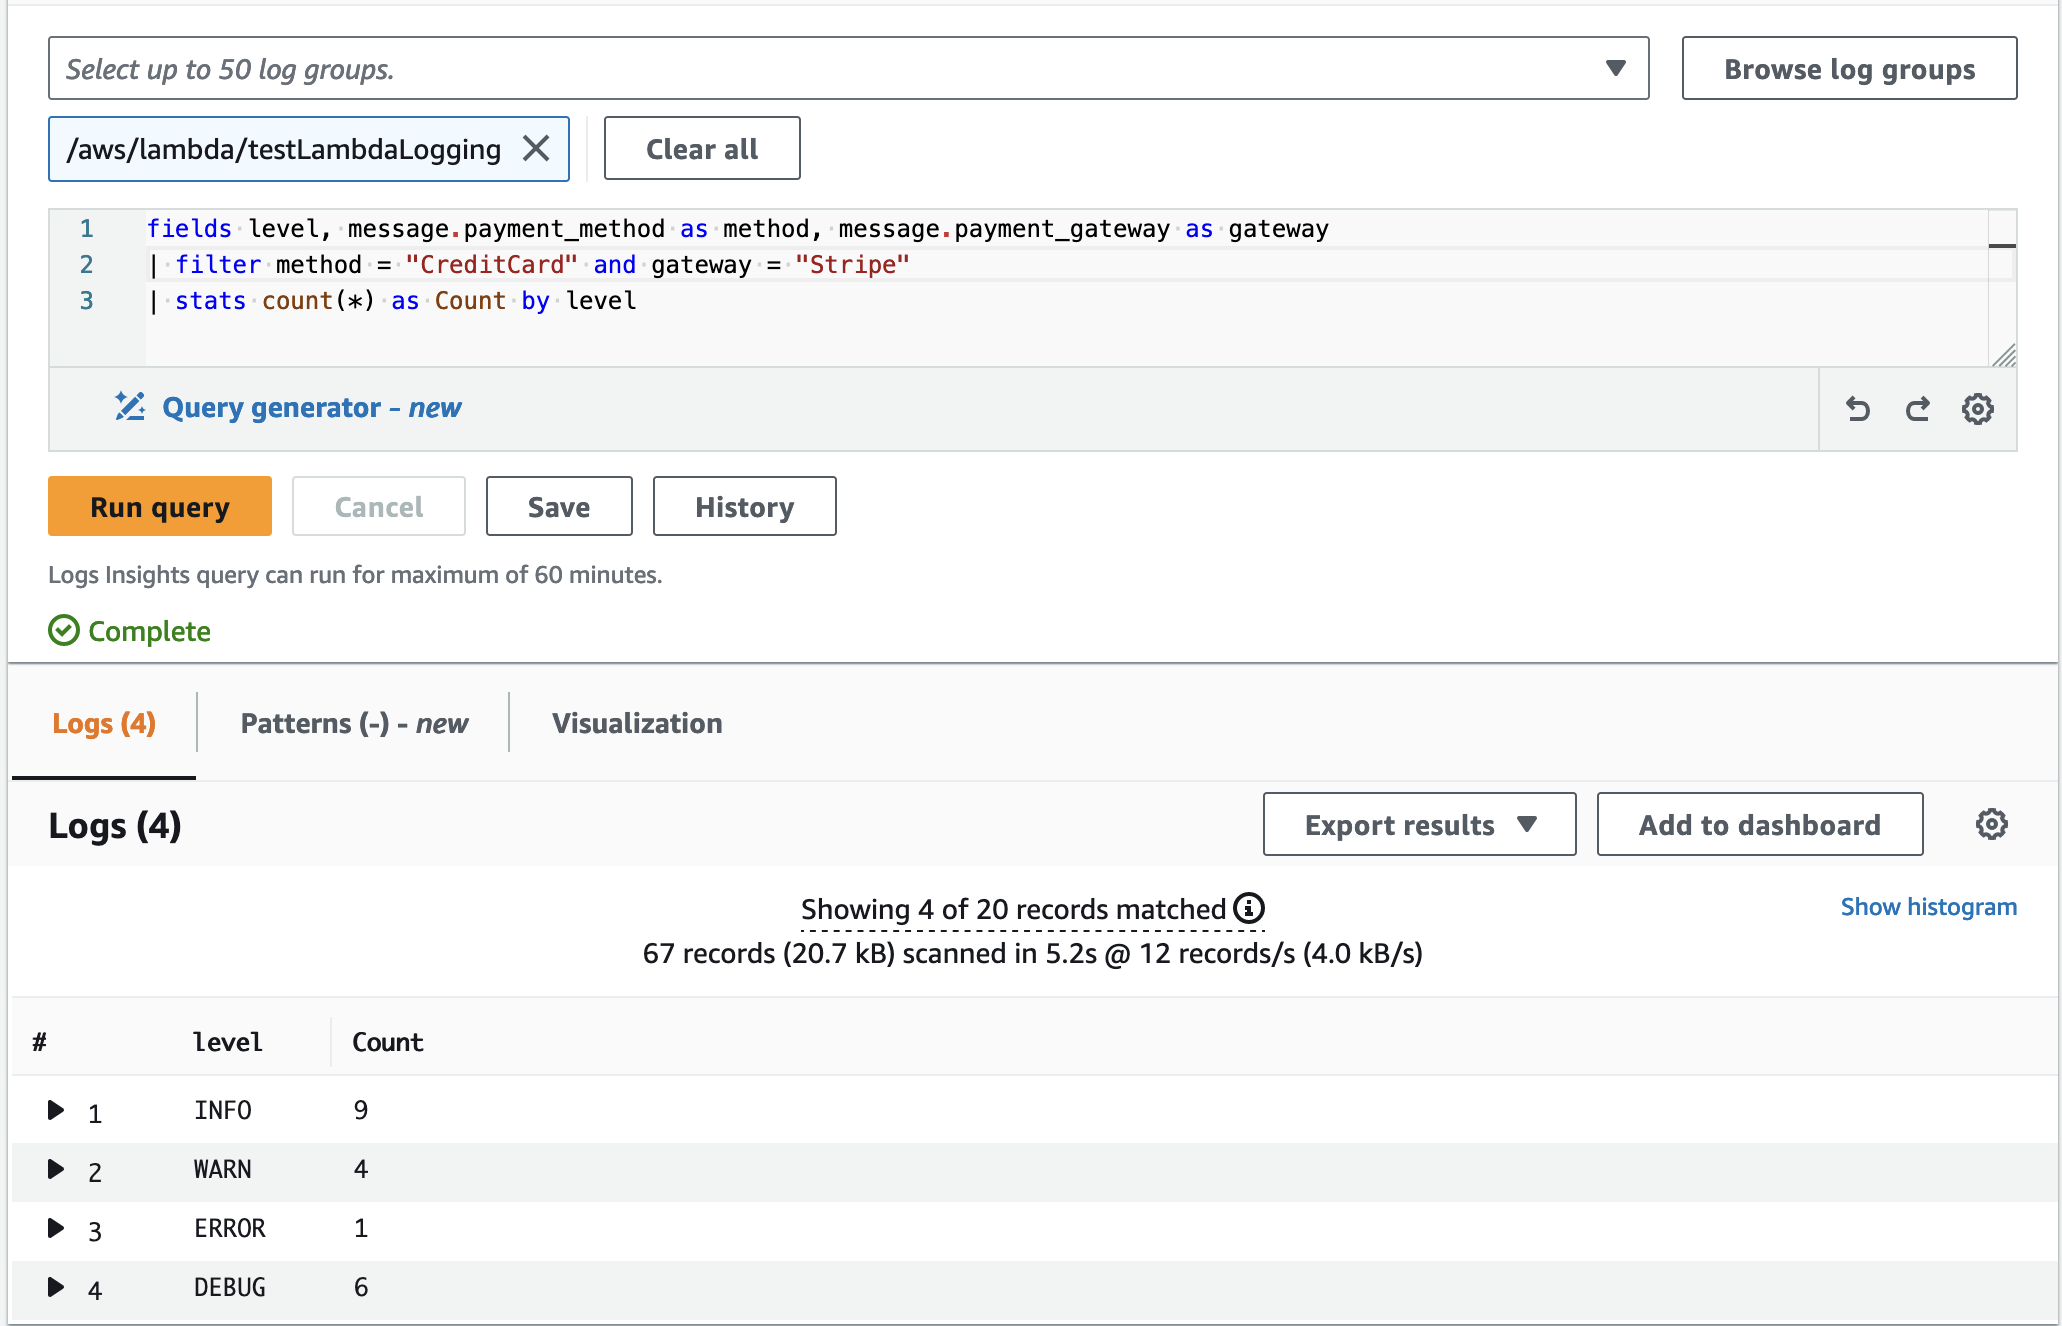
We're working to count the total number of logs for each level, using a command called 'stats' and a counter. We've added a filter to only get logs related to CreditCard payments and the Stripe payment gateway. This helps us derive insights into the number of successful and failed transactions over a specific period, which helps in understanding and improving our payment processes.
CloudWatch Insights Pricing:
CloudWatch comes under the always free category and in the free tier we can get 10 custom metric alarms, 5GB of log data, and 1 Million API requests (not including GetMetricData, GetInsightRuleReport, and GetMetricWidgetImage: these 3 operations are always charged), etc
If we run Metrics Insights queries through the CloudWatch console, it incurs no charge. When we run Metrics Insights queries programmatically using AWS CLI, SDK, or AWS CloudFormation, the query is charged based on the number of metrics analyzed, regardless of how you output the results.
In the above example, we have a total of 100 Cloudwatch log streams and each log stream has 50 metrics. Let's consider the query in the image to calculate the pricing
fields level, message.payment_method as method, message.payment_gateway as gateway
| filter method = "CreditCard" and gateway = "Stripe"
| stats count(*) as Count by level
Here we are trying to fetch the data for 3 metrics add a filter on two of them and then run the stats command to get the final count for each level. Though the result includes only two metrics (level and the count), the pricing calculation considers all three metrics (level, payment method, payment gateway) obtained during the initial data retrieval process.
Considering the analysis of three metrics from each of the 100 log streams, the total number of metrics examined amounts to 300. According to the pricing structure, the cost for Metric Insights is $0.01 per 1,000 metrics analyzed.
The cost for analyzing 300 metrics is calculated as follows:
Query charge = (300/1000) * $0.01
This calculation would result in a charge of $0.003
For more details on CloudWatch pricing and more example calculations CloudWatch Pricing