ChatGPT
  Perplexity
  Gemini
  Claude AI
 If you are a developer you might know what an ERROR is, it is a mistake that one has made while writing the code, it is also referred to as “bugs”. And the process of solving those bugs is called “debugging”.
Serverless architecture reduces the complexity of managing the infrastructure, making it easier to build and develop applications. But the error handling and debugging become more complex since the serverless applications are highly distributed and event-driven. In this article, we are focusing on ways of debugging the issues in a serverless application. So let's look at some tools which helps us to do the same.
Best tools for Managing Observability On Serverless Applications
1. CloudWatch
CloudWatch service is provided for monitoring AWS resources and applications which we run on AWS. This tool makes it easy for us to monitor our applications using generated CloudWatch logs, hence easier to discover and eliminate the existing issue.
Using CloudWatch collecting and tracking metrics becomes easy, you can monitor all the events occurring in your application on AWS, you can also create alarms based on the metric threshold you specify.

In CloudWatch every log is grouped according to the service it is associated with. Select which logs you want to see, then you are presented with the log events which consist of all the logs of that particular group where you can search for the error if it exists and and figure out a solution.
Now let’s talk about costing...
Pricing :
CloudWatch Free Tier : AWS provides three types of free tiers
- Always free - Never expires and available to all users
- 12 months free - These are available for free for 12 months since your initial sign up
- Trials - These are short term trial offers starting from the day you chose.
The always free offer gives you access to the following:
- 10 custom metrics
- 10 alarms
- 10,00,000 API requests
- 5GB of log data ingestion and 5GB of log data archive
- 3 dashboard with up to 50 metrics each per month
CloudWatch Paid Tier : The pricing for Amazon CloudWatch paid tier differs by region, as do most AWS products, and they are subject to change. To get the most accurate prices for your region, you’ll need to check the CloudWatch pricing page or use the AWS pricing calculator to determine the costs for your specific use case.
CloudWatch pricing is calculated based on the feature you use. These include:- Metrics, including API’s and metric streams
- Dashboards
- Alarms
- Logs
- Events
- Contributor insights
- Canaries
In conclusion AWS CloudWatch offers you a powerful platform to monitor your infrastructure and applications. While doing so, it offers single-interface visibility, low-latency metric collection, log Insights, and resource utilization insights. CloudWatch also collects data while offering credible insights on system performance, resource optimization, and your application’s operational health. This data is visualized dynamically on dashboards so you can access information on your services, applications, and resources from a single screen.
2. Sentry
Sentry is an error tracking open-source tool that provides you with "real-time insight into production deployments with info to reproduce and fix crashes". It notifies you of exceptions or errors that your users run into while using your app, and organizes them for you on a web dashboard.
Difference between using sentry and logging is, logging provides you with a trail of events of an application, sometimes those are errors but most of the times they are just informational, but sentry focuses on exceptions, basically it captures application crashes.
How to use :
This guide is specifically for AWS lambda, for more you can visit docs.sentry.io
For installation run
npm install --save @sentry/serverless
You can use the AWS Lambda integration for the Node like this
const Sentry = require("@sentry/serverless");

Sentry.AWSLambda.init({
dsn: "https://3310010cf44f495f9d1f1bf9e336e3a5@o1063619.ingest.sentry.io/6054129",

// We recommend adjusting this value in production, or using tracesSampler
// for finer control
tracesSampleRate: 1.0,
});

exports.handler = Sentry.AWSLambda.wrapHandler(async (event, context) => {
// Your handler code
});
With the AWS Lambda integration enabled, the Node SDK will:
- Automatically report all events from your Lambda Functions.
- Allows you to modify the transaction sample rate using
tracesSampleRate. - Issue reports automatically include:
- A link to the cloudwatch logs
- Function details
- sys.argv for the function
- AWS Request ID
- Function execution time
- Function version
- Sentry holds the thread for up to 2 seconds to report errors. You can change flush time limit by defining a flushTimeout value in the handler options
Pricing :
Sentry provides us with three options
Developer : Limited Error and Performance Monitoring.
- Support for all languages
- Release tracking
- Community forums
Fee - $0/month.
Team : Core Error and Performance Monitoring with flexible event volume.
- Unlimited members
- Third party integrations
- Metric alerts
Fee - $26/month.
Business : Standardized Error and Performance Monitoring with insights powered by Discover.
- Advanced analytics
- Cross-project visibility
- SAML support
- Custom Dashboards
Fee - $80/month.
3. Lumigo
Much like sentry lumigo is a cloud native application monitoring and debugging platform.
Lumigo builds a virtual stack trace of all services participating in the transaction. Everything is displayed in a visual map that can be searched and filtered.

With one click and no manual code changes, Lumigo visualizes your entire environment, including your Lambdas, other AWS services, and every API call and external SaaS service.
Using machine learning, Lumigo’s predictive analytics identifies and alerts on issues before they impact application performance or costs.
How to use :
- Create an IAM role for lumigo
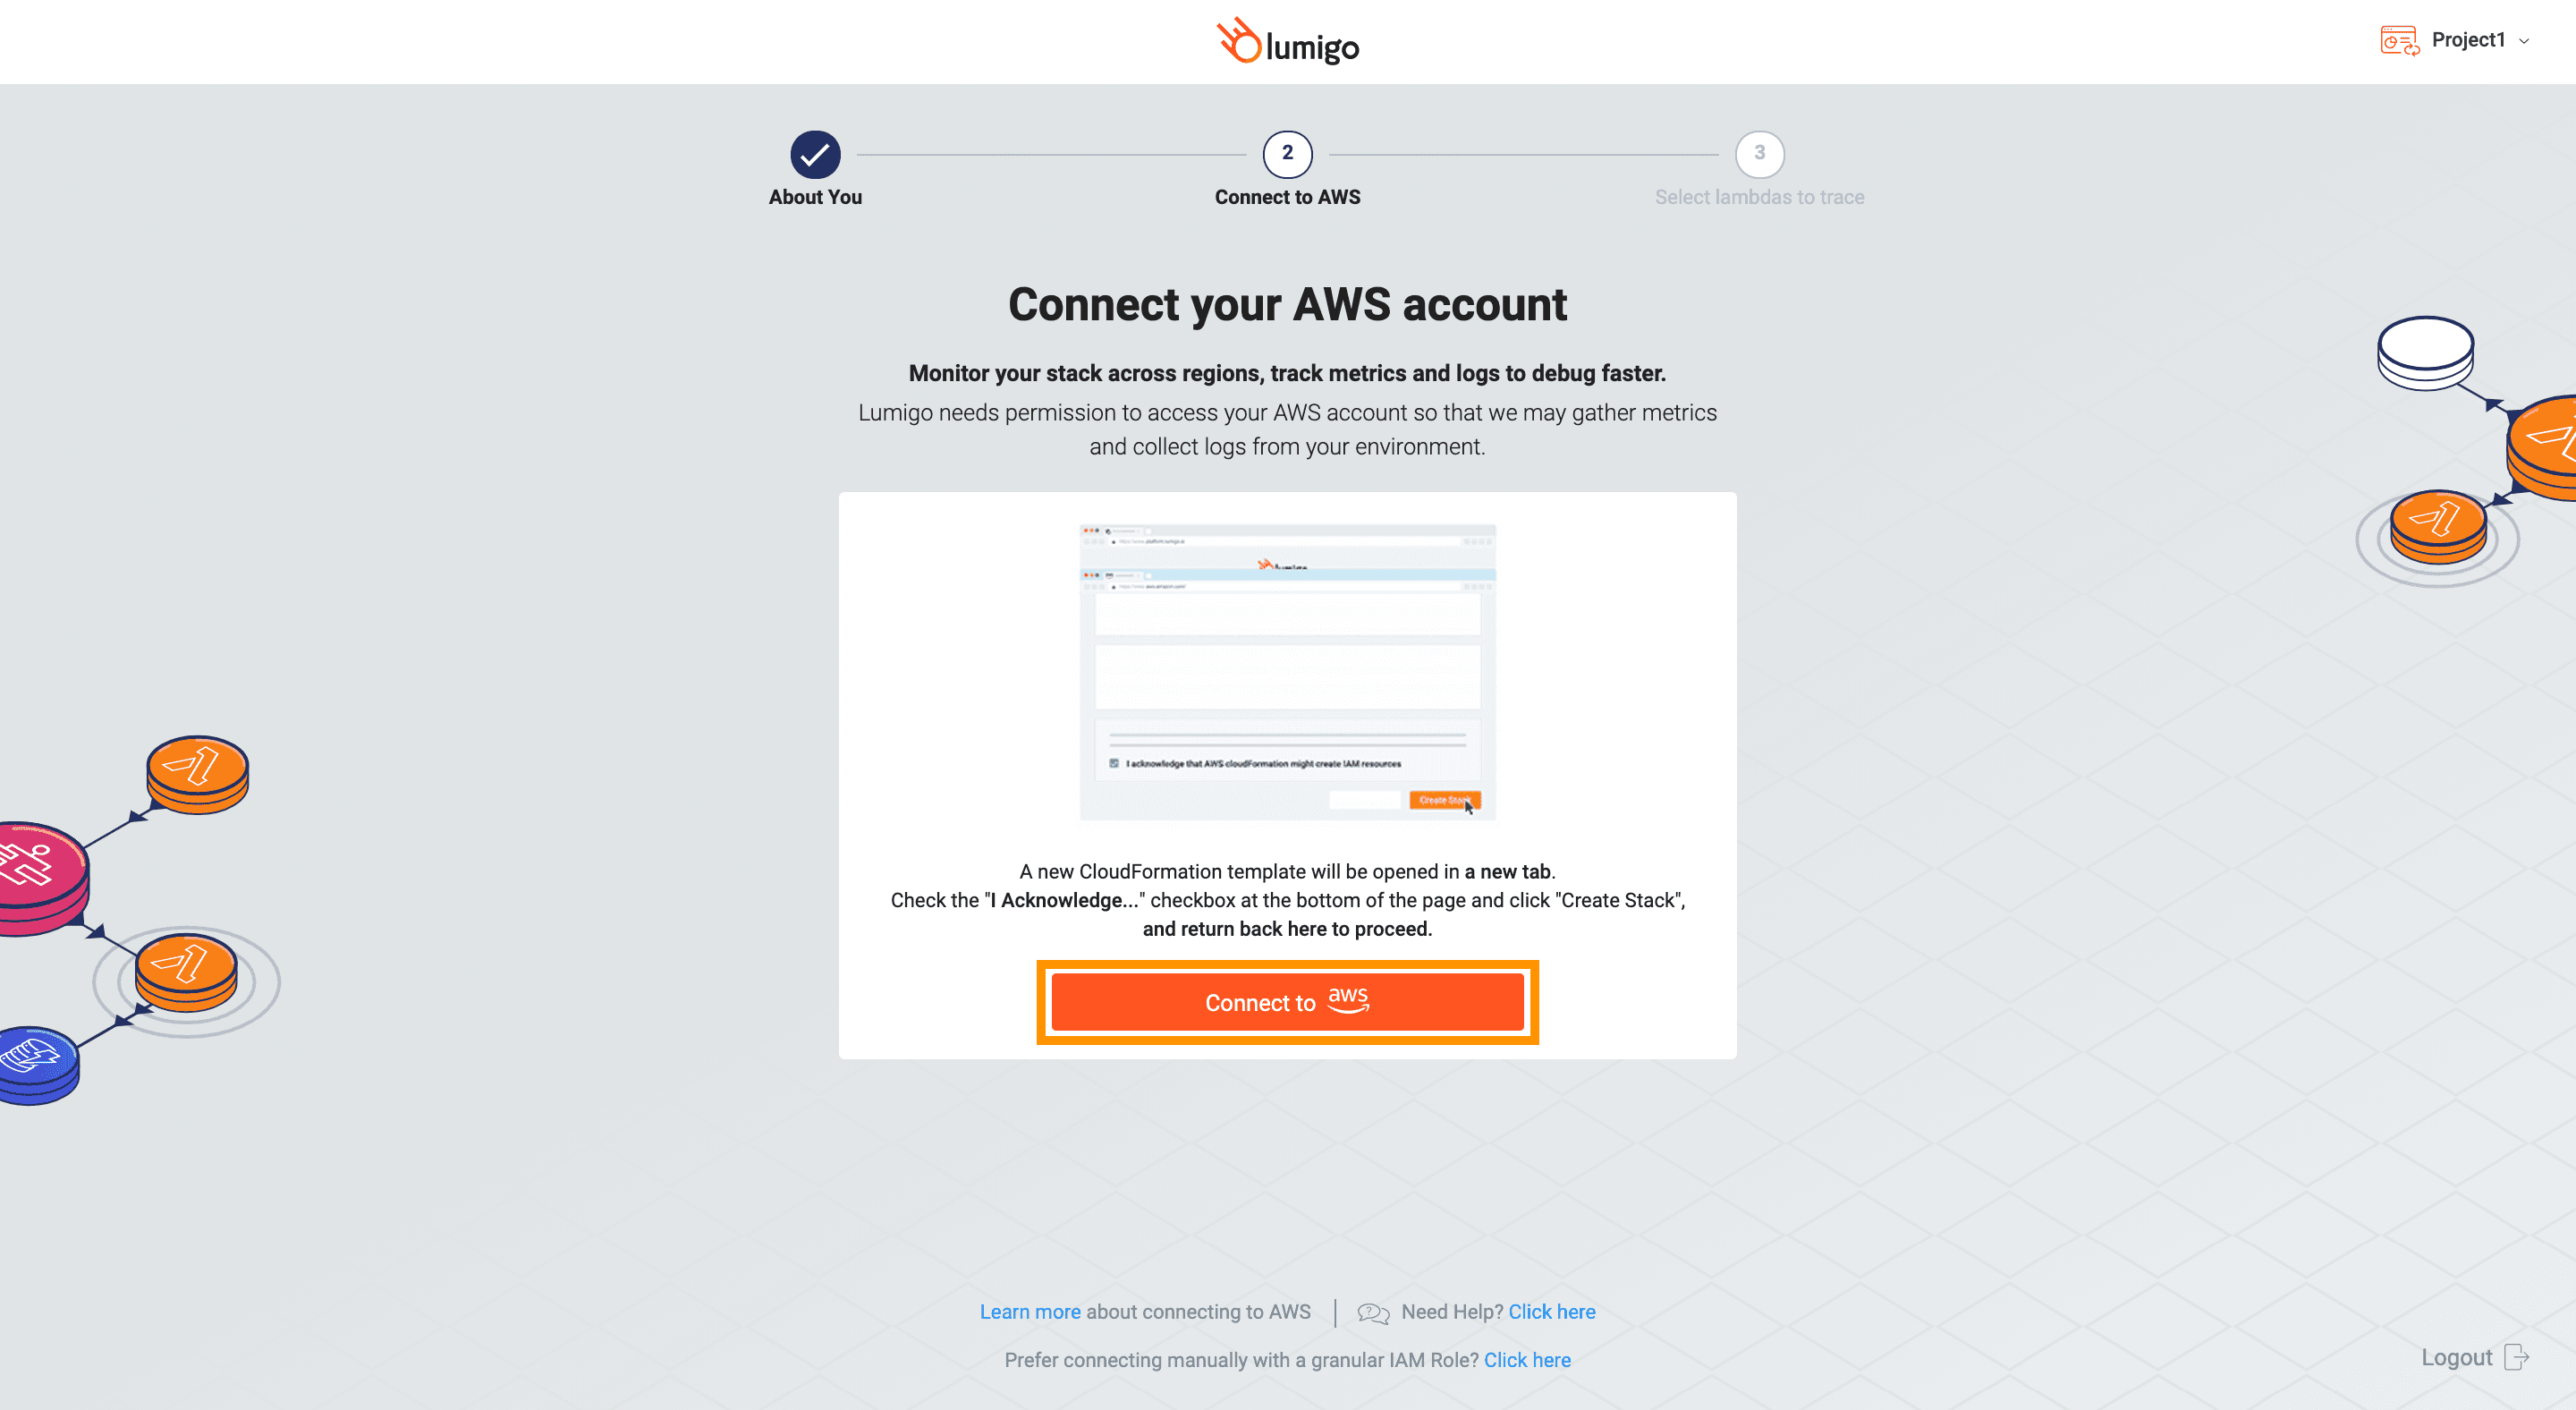
The first step is to grant Lumigo permission to gather metrics and collect logs from your AWS environment by creating an IAM (Identity and Access Management) role for Lumigo.- In the Lumigo dashboard, click Connect Lumigo to connect to the “Quick Create Stack” wizard in your CloudFormation console.
- Accept all the default settings, and check I acknowledge that AWS Cloud Formation might create IAM resources and click Create stack
- Set up distributed tracing
Now that your AWS and Lumigo accounts are linked, you need to tie Lumigo's tracer into your Lambda functions. This addition is crucial in allowing Lumigo to analyze logical flows, analyze performance, display debug information, produce insights, and generate alerts. Deploy Lumigo’s tracer is fast, simple, and straightforward, and moreover, you have the option of choosing either auto-tracing or manual tracing.
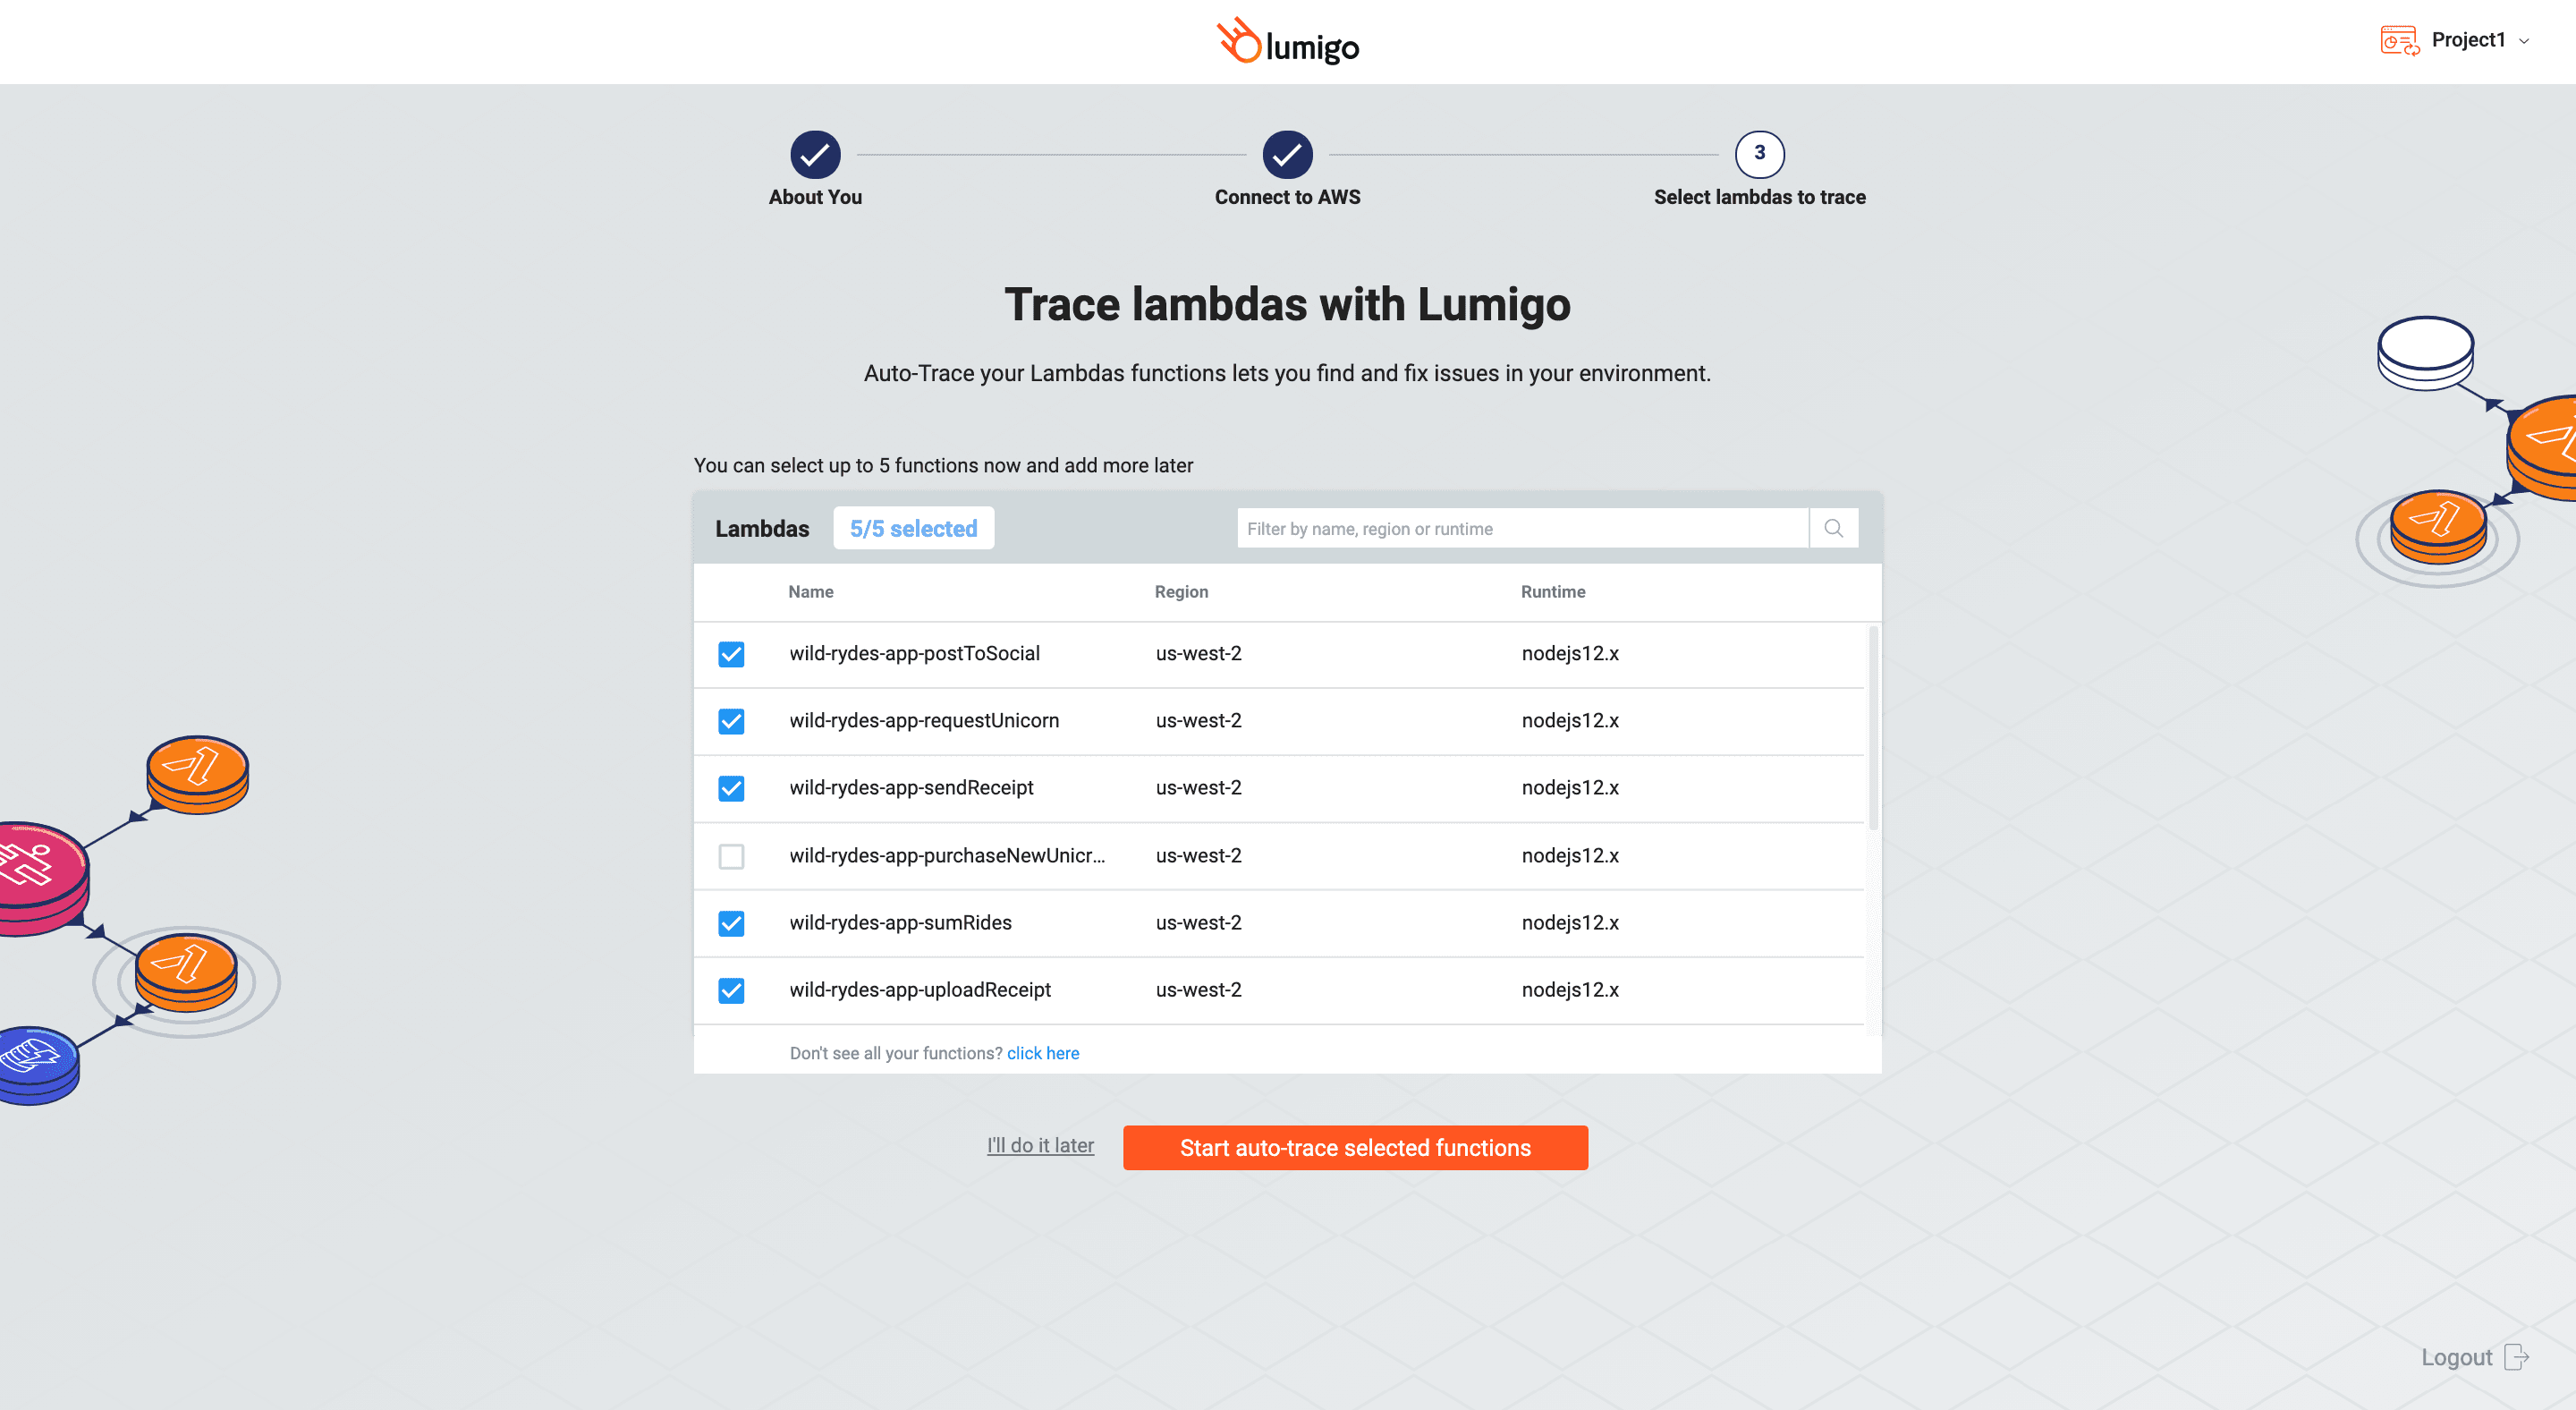
Auto Tracing :
Auto-tracing automatically deploys the Lumigo tracer into your Lambda functions, enabling you to take full advantage of its functionality without modifying your source code. For more information, see Auto-Tracing.
Manual Tracing :
Manual tracing enables you to control the Lumigo’s tracer from within your source code, using our dedicated tracing functionality in any way needed. Manual tracing gives you access to more advanced tracing information and allows you to integrate Lumigo into your CI/CD pipeline. For more information, see Manual Tracing.
Pricing :
Lumigo provide three options
Free :
- 1M invocation
- 150K traced invocation
- Unlimited users
- Chat & Email support
- Community slack channel
Fee - $0/month.
Standard :
- 5M invocation
- 1M traced invocation
- Unlimited users
- Chat & Email support
- Private slack channel
Fee - $99/month - Paid annually, $119/month - Paid monthly
Plus :
- 25M invocation
- 5M traced invocation
- Unlimited users
- Chat & Email support
- Private slack channel
- Success Manager
Fee - $299/month - Paid annually, $359/month - Paid monthly
So there it is, We have talked a bit about errors and various steps and tools to handle it. Now it’s your time to go and choose your partner for debugging.